


- Ohioan farmer Samuel Benner predicted market volatility from 1924 to 2059 in a chart published in 1884.
- The 27-year Benner Cycle shows significant differences in stock market performance between favorable and unfavorable years.
- Benner’s theories on the 54-year Major Cycle also hold up, with favorable years outperforming unfavorable years.
- The S&P 500 should outperform its historical average for the rest of 2024 through 2026, and underperform for 2027 through 2032.
Introduction
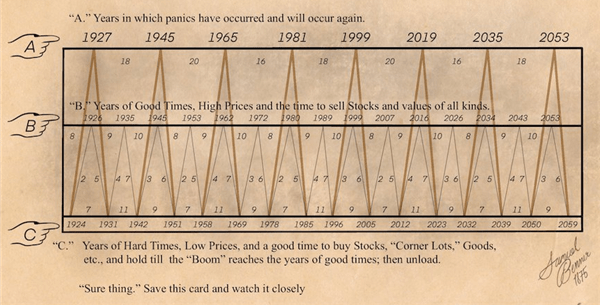
One may have seen the following graphic from an Ohioan farmer, Samuel Benner. It was originally published in 1884 where he predicted the volatility of future markets from 1924 to 2059.
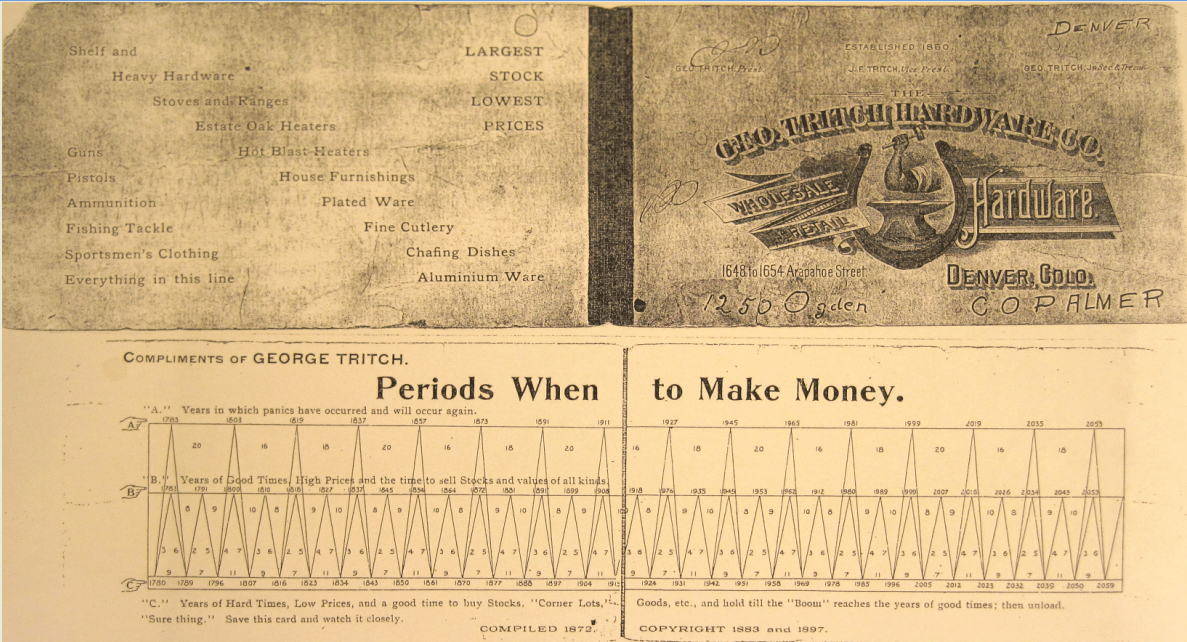
There is a more extensive chart if one is willing to look that uses back tested data.
It is a bit tough to read, but a pretty good video on YouTube explains how to interpret it. The key is to understand that the stock price movements will happen the calendar year after the one printed. For example, it shows that the stock market outperforms its historical average from 2024 to 2026 and will underperform from 2027 to 2032. That means one should be aggressive for this year and the next two years. For the subsequent six years, one should be more conservative. I will show you why.
As I go through my analysis, I want to thank Professor Edward McQuarrie for sharing his database. I also used data from Goetzman, Ibbotson & Peng, Jeremy Siegel, Robert Shiller, and The NYU Stern School of Business for my review.
The 27-Year Cycle
If one looks at the charts, one sees a series of minor cycles that are 7-, 9-, and 11-years long. The patterns are very distinct and have the following repetitions:
| Benner 27-Year Cycle | Favorable Years | Unfavorable Years |
| 7-Year Phase | 2 Years | 5 Years |
| 11-Year Phase | 4 Years | 7 Years |
| 9-Year Phase | 3 Years | 6 Years |
It is worth noting that the pattern starts with a 7-year cycle, followed by an 11-year cycle, and finishes with a 9-year cycle.
When I scan the dozens of articles about the Benner Cycles, there is a complete lack of understanding about what we are looking at. Too many people are trying to predict a specific year when a market might crash, instead, they need to look at the unfavorable years as periods when the stock market underperforms its historical average. This is where I would like to compare the 27-year Benner Cycle to the historical stock market returns since 1793.
| Benner 27 Year Cycle (1793-2023) | Average | Standard Deviation | Number of Years |
| Favorable Years | 11.70% | 15.26% | 76 |
| Unfavorable Years | 6.57% | 18.04% | 155 |
| Average Total Return | 8.23% | 17.34% | 231 |
If one were to break down the Benner Cycle as such, one can see a significant difference (ρ = 0.0354) in stock market performance between favorable years and unfavorable years. During the favorable years, the stock market has averaged an annual return of 11.70% (±15.26%), which is far better than the meager returns (6.57% ± 18.045) during the unfavorable years. If we were to focus on the period many believe Benner was predicting, we find similar significant differences (ρ = 0.0344).
| Benner 27 Year Cycle (1925-2023) | Average | Standard Deviation | Number of Years |
| Favorable Years | 16.62% | 12.99% | 33 |
| Unfavorable Years | 7.19% | 23.14% | 66 |
| Average Total Return | 10.25% | 20.71% | 99 |
One can claim Benner was accurate in his future predictions about 1925-2023. I also find it interesting that the volatility during favorable years is half the volatility seen during unfavorable years.
As a disclosure, it is worth noting that the average for the unfavorable years still showed opportunities to generate an investment gain. There was still a five in eight chance of seeing a positive return. Any claim that the Benner cycle can predict a “market crash” needs to be viewed cynically.
So How Do I Use This?
According to Benner, two-thirds of the years are “unfavorable.” Given that we have had sixty-two down years since 1793 and 27 years when losses amounted to more than 10%, it is not a statistical accident that some years would be part of any declared period of investment stagnation. My data shows that 74.2% (±5.6%) of the negative years happened during these unfavorable periods. I can claim some significance (ρ = 0.090) since this is more than the expected 67%.
Where this chart might be useful is anticipating the possibility of potential losses greater than 10%. Of the 27 times the market has seen these corrections, 22 or 81.5% (±4.6%) happened during the unfavorable periods. This would include the six out of seven years when the market suffered losses greater than 20%.
If one were to use this kind of tool, it would be useful in helping one to understand that after the markets have gone through a period (2 years to 4 years) of aggressive gains, it would be prudent for one to take action to hedge against market downturns. Even with that, one should never use this tool as an absolute. For example, 2017-2023 were unfavorable years, yet generated a market gain of over 100%; even with the COVID crisis in 2020 and the bond shock in 2022.
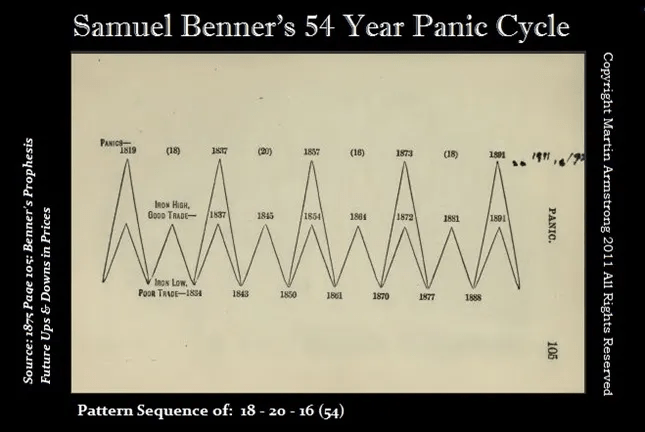
The 54-Year Major Cycle
Either for 16-, 18-, or 20-year periods, Benner claimed there would be periods of even greater market shocks that would be more pronounced than what might be seen during the minor periods. 2023 saw the completion of the most recent cycle. These cycles do not happen in succession. They have periods where they are followed by the more minor periods. When these cycles occurred, they came in three types of phases. Here is a table showing how the major cycles work with the minor cycles.
| Benner 54-Year Cycle | Favorable Years | Unfavorable Years |
| 7 Year Phase (Major Cycle) | 3 Years | 4 Years |
| 11 Year Phase (Minor Cycle) | 4 Years | 7 Years |
| 9 Year Phase (Major Cycle) | 3 Years | 6 Years |
| 7 Year Phase (Minor Cycle) | 2 Years | 5 Years |
| 11 Year Phase (Major Cycle) | 7 Years | 4 Years |
| 9 Year Phase (Minor Cycle) | 3 Years | 6 Years |
Here is a chart showing these alternating cycles, so one can see how these phases occur over a 54-year period.
Like the 27-year cycle analysis, Benner’s theories seem to hold up with this series of phases also.
| Benner 54 Year Cycle (1793-2023) | Average | Standard Deviation | Years |
| Favorable Years | 9.92% | 14.39% | 59 |
| Unfavorable Years | 4.69% | 18.22% | 60 |
The favorable years outperform the unfavorable years (9.92% v. 4.69%) with a lesser level of volatility (14.39% v. 18.22%). The difference for these two groups is significant (ρ = 0.0829) if one assumes the hypothesis that they cannot be equal. What is interesting are the predictions for 1925-2023. The results are very telling.
| Benner 54 Year Cycle (1925-2023) | Average | Standard Deviation | Count |
| Favorable Years | 17.54% | 12.01% | 26 |
| Unfavorable Years | 4.76% | 23.29% | 28 |
Mr. Benner did quite well with his predictions, and they were significant (ρ = 0.0163). The favorable years (17.54% ± 12.01%) outperformed the unfavorable years (4.76% ± 23.29%).
It is again necessary to point out that unfavorable periods are not automatically periods where one loses portfolio value. The data merely shows that losses were more likely.
Our Take
The data suggests that Mr. Benner saw certain patterns in market prices, and one might apply them to the stock market. The statistics are compelling. Even if we were to disaggregate the data to separate it between major and minor cycles and the 7-, 9-, and 11-year phases, the results are significantly different between favorable years and unfavorable years.
| Cycles | Favorable Years | Unfavorable Years | Difference |
| 27 Year Cycle | 11.70% | 6.57% | 5.12% |
| 7 Year Minor Phase | 11.08% | 7.60% | 3.48% |
| 9 Year Minor Phase | 13.13% | 5.58% | 7.56% |
| 11 Year Minor Phase | 11.02% | 6.61% | 4.40% |
| 54 Year Cycle | 9.92% | 4.69% | 5.23% |
| 7 Year Major Phase | 9.97% | 2.34% | 7.63% |
| 9 Year Major Phase | 12.97% | 5.74% | 7.23% |
| 11 Year Major Phase | 8.88% | 5.35% | 3.53% |
2024 marks the beginning of a minor nine-year phase where 2024-2026 are favorable years and 2027-2032 are unfavorable years. On average, the minor nine-year phase has seen an overall growth rate of 100.6%. Past performance is not an indicator of future returns.
So far, 2024 is a robust year for those who invested in the S&P 500. So far, the market has seen a total return of 15.12%. According to the historical data, 2024 through 2026 should be prime investing years, so one should stay aggressive. After 2026 through 2032, the market will slow down, and there could even be a market correction. I am guessing that year will be 2029.
Since 1793, there have been periods of 2 to 7 years when the market has outsized gains, the data also shows that there will be periods of 4 to 6 years when it would have been prudent to pull back and find alternative investments that could potentially outperform the market. Adjust your strategies accordingly.
Article courtesy of SeekingAlpha
Các Khoảng Thời Gian Khi Nên Kiếm Tiền: Kiểm Tra Thực Tế Lý Thuyết Chu Kỳ Thị Trường Vĩnh Cửu của Samuel Benner

Hãy tưởng tượng bạn mất tất cả những gì bạn sở hữu trong một sự suy thoái kinh tế tàn khốc. Hầu hết mọi người sẽ cảm thấy thất bại, nhưng nông dân Ohio Samuel Benner đã quyết định làm điều gì đó về nó. Thay vì cố gắng xây dựng lại trang trại theo cách truyền thống, Benner đã trở nên ám ảnh với việc hiểu thị trường, tỉ mỉ phân tích dữ liệu lịch sử để phát hiện các mẫu hình. Công cụ của ông? Bút, giấy, và một hỗn hợp kỳ lạ của giá lợn, sắt, và dữ liệu ngũ cốc.
Hiểu Biết Lớn của Benner: Các Chu Kỳ Thị Trường
Benner hình dung thị trường như một loại nhịp điệu hoặc nhịp tim, một điệu nhảy có thể dự đoán được của các đỉnh, đáy và cao nguyên. Đây là điểm chính của phát hiện của ông:
Đỉnh – Thời điểm để bán cao
Đáy – Cơ hội để mua thấp
Cao nguyên – Khoảnh khắc để HODL (giữ thật chặt)
Ông nhận thấy những mẫu hình này theo một thời gian nhất định, với các chu kỳ bùng nổ mỗi 8-9 năm, các sự sụp đổ lớn mỗi 16-18 năm, và các khoảng thời gian ổn định hơn ở giữa. Ý tưởng này thật sự mang tính đột phá, vì nó gợi ý rằng các thị trường không hoàn toàn hỗn loạn mà di chuyển theo các chu kỳ có thể, lý thuyết mà nói, được dự đoán.
Tiến Lên: Chu Kỳ của Benner Có Vẫn Đúng Không?
Tiến về hiện tại. Những lý thuyết của Benner đã thu hút được những người đam mê tài chính đã thử nghiệm các dự đoán của ông với các thị trường hiện đại, đặc biệt là S&P 500. Tin hay không thì tùy bạn, nhưng chu kỳ của Benner khớp một cách bất ngờ với một vài sự kiện lớn trên thị trường:
Cuộc Đại Khủng Hoảng vào những năm 1930,
Bong bóng dot-com phát nổ vào đầu những năm 2000,
Và cuộc khủng hoảng tài chính năm 2008.
Trong khi sự phù hợp không hoàn hảo—các thị trường còn xa mới là những cỗ máy hoàn hảo—xu hướng chung trong các chu kỳ của Benner thực sự tương đồng với những sự suy thoái tài chính và phục hồi đáng kể.
Kiểm Tra Thực Tế: Chu Kỳ của Benner Có Thật Sự Hoạt Động Không?
Trước khi chúng ta đi sâu hơn, hãy làm rõ một điều. Tôi đã kiểm tra các sự thật, và những dự đoán của Benner không chỉ là trí tuệ dân gian; chúng có trọng lượng nhất định.

Bằng cách phân tích các chu kỳ trong S&P 500, các nhà phân tích hiện đại đã tìm thấy những nhịp điệu tương tự, đặc biệt là quanh các sự kiện kinh tế quan trọng. Mặc dù chu kỳ của Benner không phải là một công cụ đo thời gian thị trường đáng tin cậy, nó được xây dựng trên những mẫu hình có thể quan sát được, thực tế. Những hiểu biết của ông không chỉ là một dự đoán may mắn—chúng là một khung để phát hiện các điểm chuyển mình tiềm năng trong thị trường.
Tại Sao Chu Kỳ của Benner Quan Trọng Đối Với Các Nhà Đầu Tư Ngày Nay
Những quan sát của Benner cung cấp hai bài học lớn cho các nhà đầu tư, đặc biệt là những người mới bắt đầu:
Lịch Sử Lặp Lại (Chà, Hơi Hơi)
Thị trường, giống như thời trang, có xu hướng tuần hoàn. Hiểu những mẫu hình này có thể giúp bạn dự đoán sự thay đổi của thị trường. Những hiểu biết của Benner cho thấy nếu bạn có thể xác định được đỉnh hoặc đáy, bạn có thể đưa ra quyết định chiến lược để tối đa hóa lợi nhuận hoặc giảm thiểu thua lỗ.Quá Khứ là Một Người Thầy Mạnh Mẽ
Mô hình của Benner không phải là một quả cầu pha lê, nhưng việc nghiên cứu các xu hướng lịch sử có thể cung cấp những gợi ý quý giá về những gì có thể xảy ra trong tương lai. Biết rằng các sự suy thoái và phục hồi xảy ra theo chu kỳ, các nhà đầu tư có thể tiếp cận thị trường với một cái nhìn tỉnh táo và dài hạn.
Suy Nghĩ Cuối Cùng: Thời Gian Thị Trường Như Benner
Lý thuyết chu kỳ thị trường của Samuel Benner, có từ những năm 1870, vẫn còn vang vọng đến hôm nay. Nó nhắc nhở rằng trong khi không ai có thể dự đoán mọi biến động của thị trường, có những mẫu hình xuất hiện theo thời gian. Đối với các nhà đầu tư mới, những hiểu biết của Benner cung cấp một góc nhìn biến hỗn loạn thị trường thành một cái gì đó có cấu trúc hơn—một điệu nhảy giữa bùng nổ và sụp đổ mà thường theo một nhịp điệu tương tự. Hiểu những chu kỳ này sẽ không làm bạn trở nên giàu có qua đêm, nhưng có thể giúp bạn có lợi thế trong việc điều hướng thế giới đầu tư không thể đoán trước.
Không có nhận xét nào